The Sample QC dashboard lets you open Gating Plots for each sample, showing how cell populations and markers were defined. This provides transparency into the underlying data so you can validate results and troubleshoot issues.
Use it to:
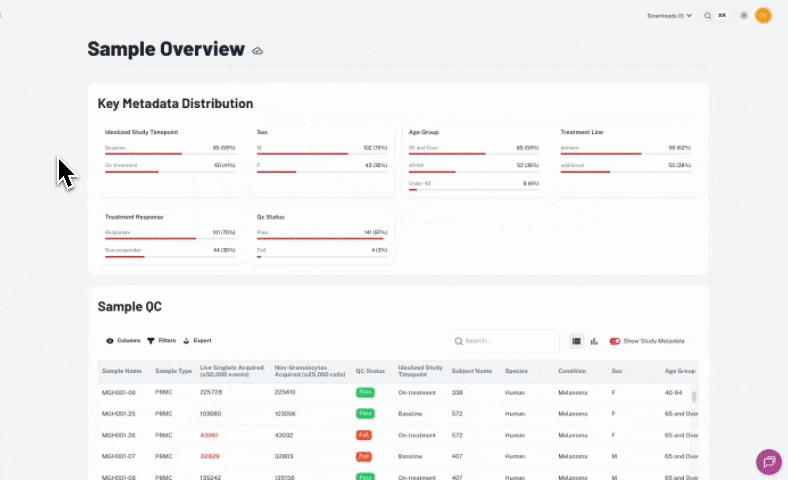
Step 1 – Navigate to Sample QC
In the left-hand sidebar, click Sample Overview, then scroll to Sample QC to view sample-level quality data.
Step 2 – Open a Sample
Click the sample name to open its gating plots.
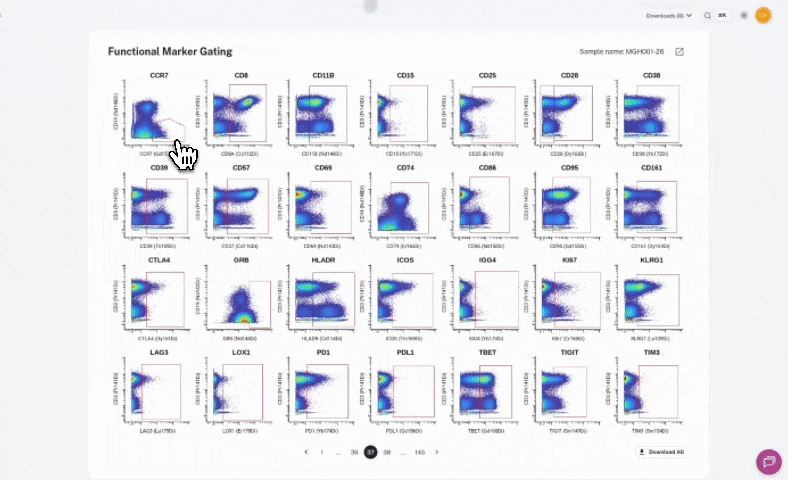
Step 3 – Review Gating Plots
Two types of plots are available:
Step 4 – Download All Gating Plots
Use the Download All option to export the full gating scheme for offline review.
This example shows how to open and review gating plots for a sample in Sample QC.
This example shows how to use the Download All option to export gating plots for offline review.


.png)