Reviewing cytometry sample data across a clinical trial can be overwhelming when you have to scroll through hundreds of rows. On the other hand, a simple pass/fail report doesn’t tell you enough about why a sample passed or failed.
The Sample QC dashboard simplifies this process by letting you filter directly on fields such as Live Singlets Acquired, Non-granulocytes Acquired, QC Status (Pass, Partial Pass, Fail), and additional study metadata. You can also expand results to see gating plots for deeper context.
Use it to:
Step 1 – Navigate to Sample QC
In the left-hand sidebar, click Sample Overview, then scroll to Sample QC to see sample-level quality data.
Step 2 – Open Filters
Click the filter menu in the top-right corner of the panel.
Step 3 – Apply QC Filters
Choose a filter to narrow results:
With Show Study Metadata toggled off, you can filter by:
With Show Study Metadata toggled on, you unlock additional filters relevant to your study. These fields vary depending on how the study was set up, but may include:
Step 4 – Export Data (Optional)
Click Export to download the filtered dataset and share it with others.
Step 5 – Combine Filters (Optional)
Layer multiple filters together for precise results.
Example: Filter by Fail (QC Status) + On-treatment (Idealized Timepoint)
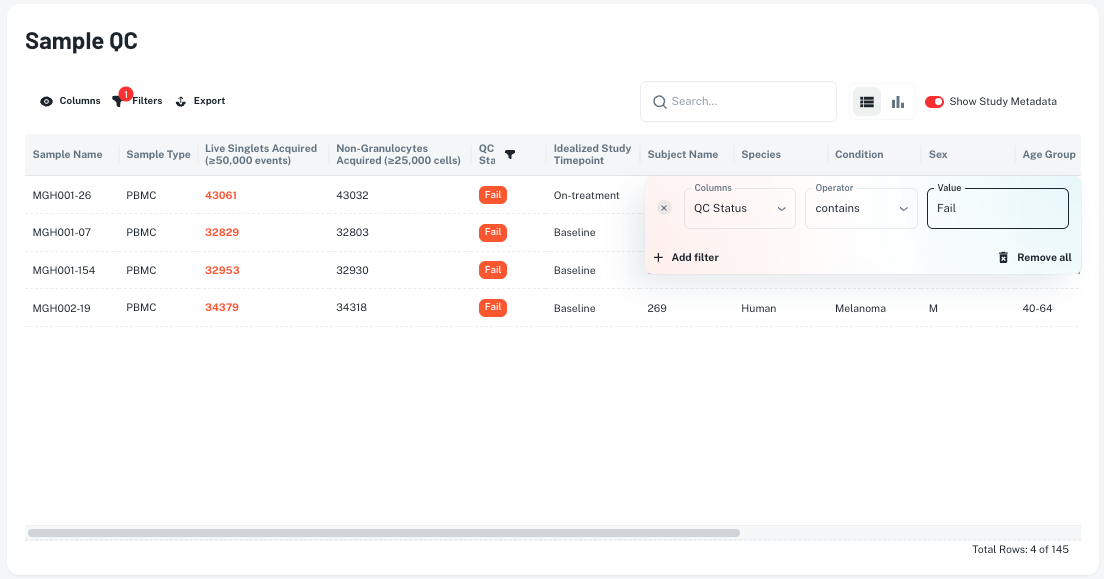
Finding: This example shows the All Samples tab filtered for QC Status = Fail. Four samples out of 145 are flagged for insufficient live singlets.
Once you’ve filtered to the samples you care about, expand them to review their Gating Schemes. In this view you can:


.png)